Announcement
Collapse
No announcement yet.
Precious Metals - My charts, Links etc
Collapse
X
-
Just to start this off, I'm going to mention what I think is the best site for learning about gold, and reading the latest news.
Jim Sinclair has been doing this since before the last gold peak in 1980, and knows almost an infinite amount more than me.
I'm just learning and very interested in the subject.
Jim Sinclair's MineSet
He does everything he does for nothing. There is no pay subscription.
IMO you can learn a lot about gold from reading his site. It may take you a little time to tune into his style of writing, but when you do, you'll see that he knows what he is talking about.
Steve
-
Some of my charts.
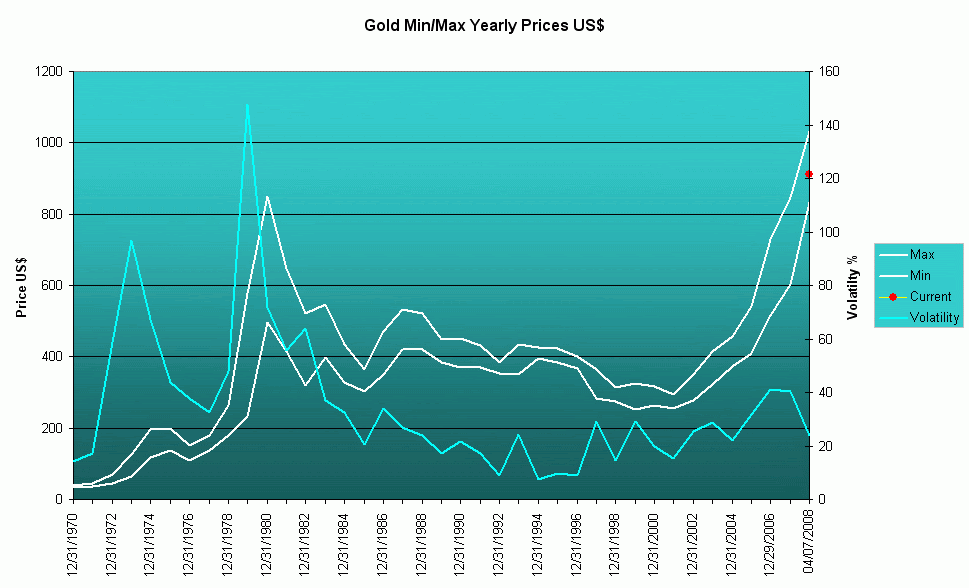
Gold in US$, with the volatility (max-min/min for each year).
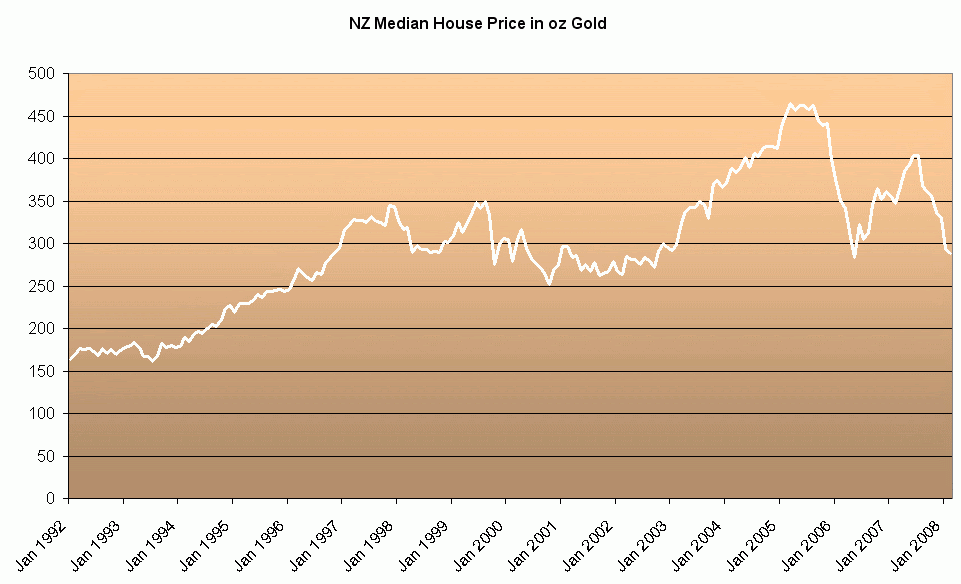
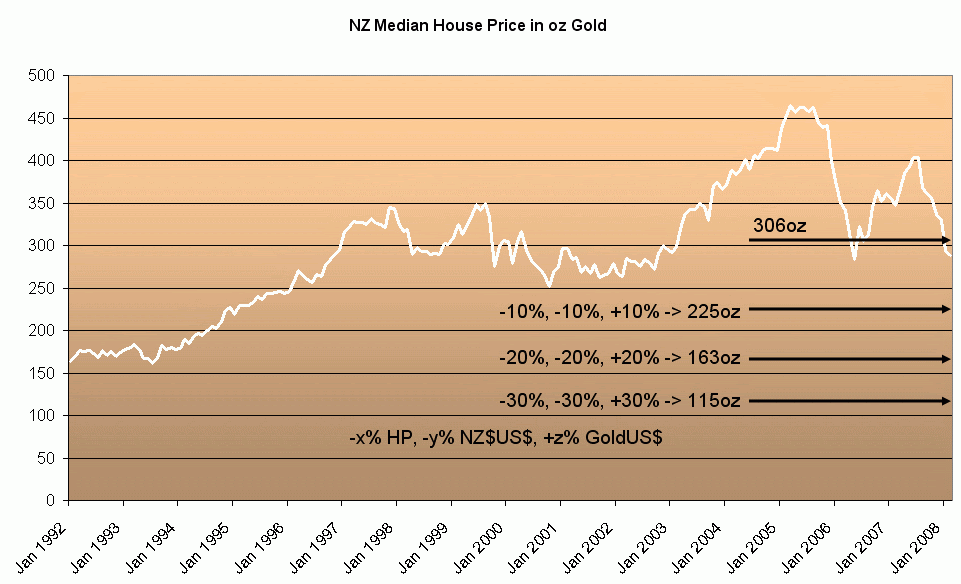
New Zealand house prices measured in oz of gold:
 Last edited by Steve Netwriter; 26-04-2008, 01:26 PM.
Comment
-
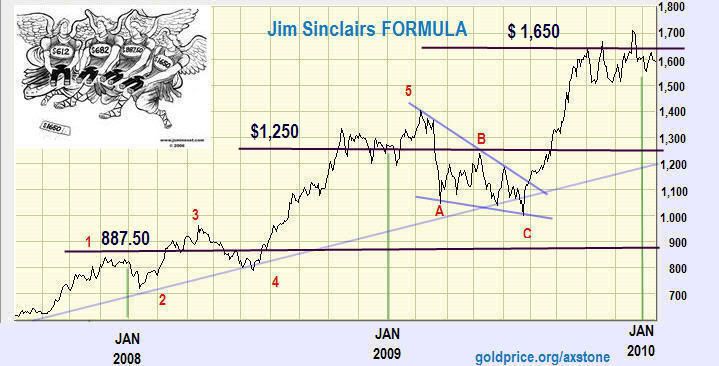
The precious metals prices do not go up in a nice gradual fashion.
So anyone investing IMO needs to do a lot of research first, and understand how volatile it is.
This is a chart from Jim Sinclair's site, which I hope gives you the idea:
I think the best advice I've read is this.
Average in. ie buy gradually over time. Try and pick the dips.
Before you buy anything, accept that the price may well go lower before going up again. So don't buy until you are reconciled to buying and holding no matter what.
Buy and hold. Or long and strong
From what I've read, this is a long-term bull phase for gold. That means until at least 2011. So ignore the noise (ups and downs) once you've bought. Just use it when buying to try and get the best prices.
Comment
-
Can you tell this is one of my pet subjects

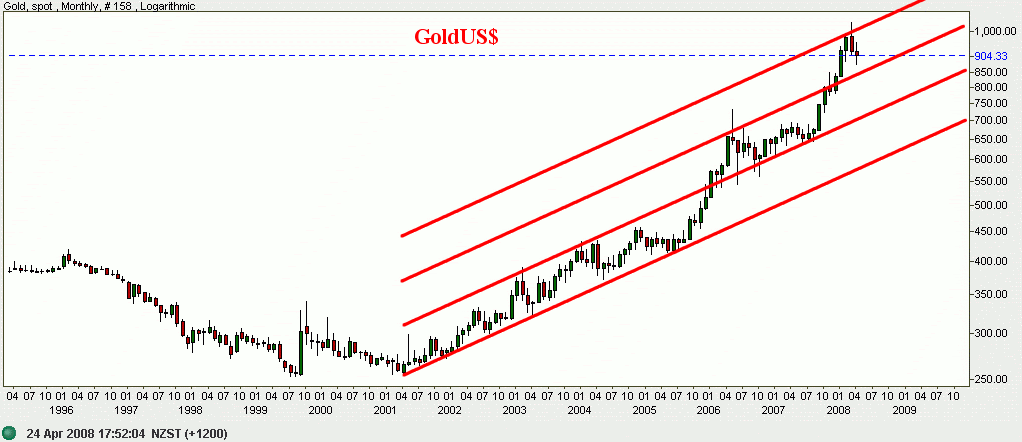
This is the way I see gold at the moment:
and a similar one for silver:
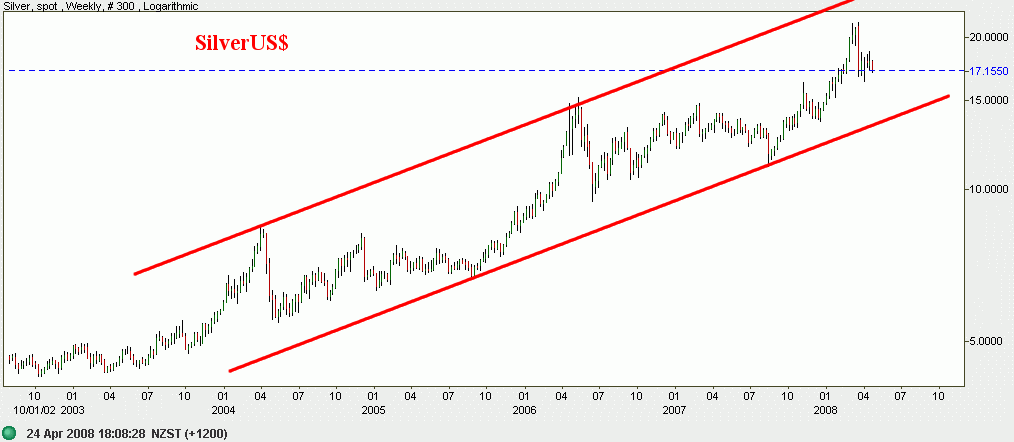
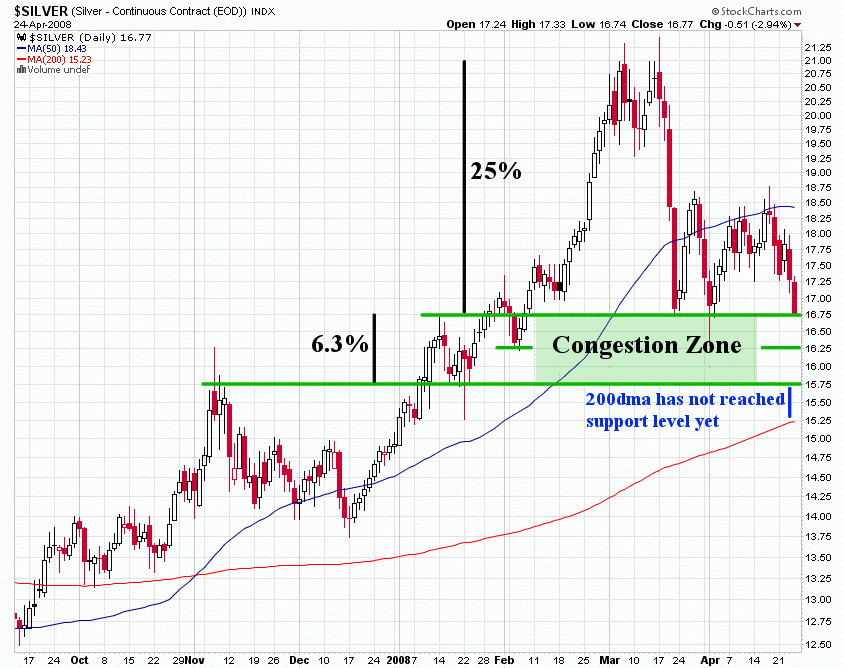
In more detail for silver, from yesterday:
In US$:
And in GBP:
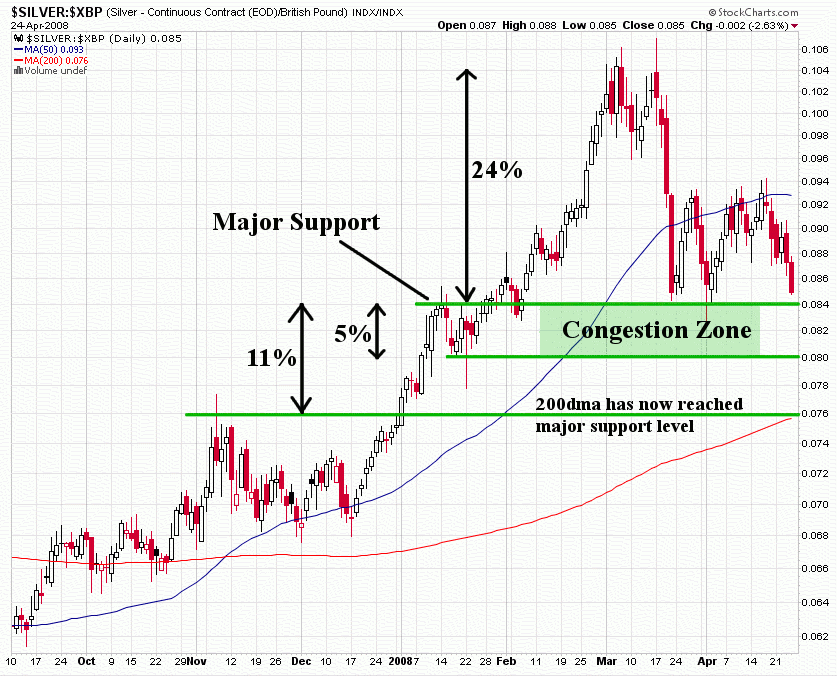
The way I analyse the charts is from techniques I've picked up from expert articles I've read. So just my view, but hopefully using reasonably sound techniques.
Comment
-
If you read articles about gold and silver, you'll probably see some references to "the cartel" and "manipulation".
There are some who do not believe the market is manipulated.
From what I've read, I think it is.
I think the best source to read about it is here:
GATA
http://www.gata.org
For example:
Chris Powell: There are no markets anymore, just interventions
and then there is this one:
The How And Why Of Gold Price Manipulation
http://www.fnarena.com/index2.cfm?type=dsp_newsitem&n=5D7455EA-17A4-1130-F5A89CE1B0211129
The simple idea is this. Paper money only works because people believe in it. Imagine what would happen if others stopped believing in the paper notes in your pocket.
And gold and silver are the oldest forms of money, and are effectively the only competition for the paper money used throughout the world.
The idea is that if gold & silver are allowed to go up in a free market, then people would notice how the purchasing power of their paper money is going down.
Comment
-
Talking of the purchasing power of paper money.
I think this is interesting.
It shows the cost of crude oil in various 'currencies'.
Notice how the cost has gone up in all the paper currencies listed, but is fairly stable when priced in gold.
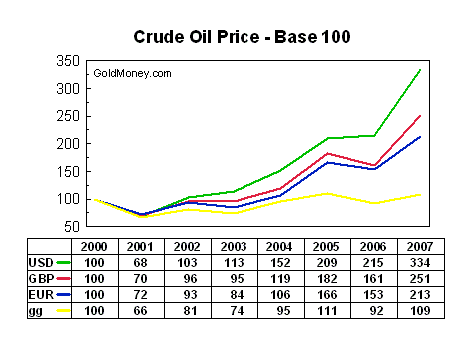
Even worse against the US$:
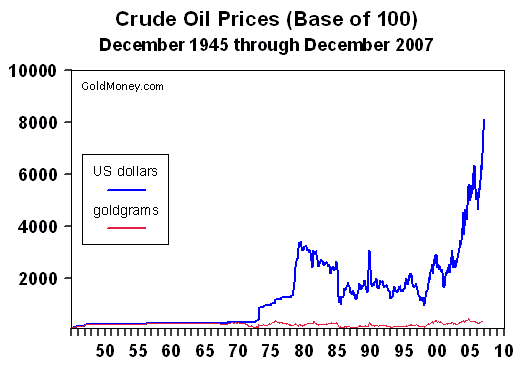
If you think about that, it should tell you something.
Comment
-
OK, anyone into investing IMO needs to understand cycles. Economies go in cycles. At any one time, certain sectors will be more profitable than others.
So, at the start of a housing boom would be the best time to invest in property.
The start of a tech bubble would be the best time to invest in tech stocks.
etc etc
If you understand and appreciate that, then you can move from sector to sector to do the best for yourself.
Since this thread is about precious metals, you'll want to know when precious metals are in a bearish phase, and when they are in a bullish phase right ?
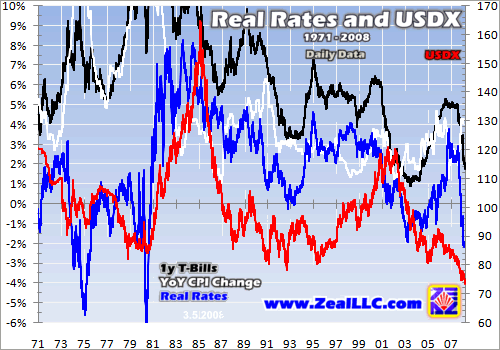
The Zeal website ( http://www.zealLLC.com )has some great charts on this.
It may take a bit of looking to understand this as it's got so many lines on it. It took me a while.
The idea is this. If interest rates are above the rate of inflation people will put their money into Treasury Bills (or equivalent). Gold will go down.
When interest rates are below the rate of inflation, people would lose money if they bough T-Bills, and so they move into real assets, like gold & silver.
When the blue line is low, gold will tend to go up.
Comment
-
Quite a few people on the internet like to compare property prices with the price of gold. Actually they ask "how many 1oz gold coins do I need to buy a house?".
By using gold as an international money, you can get a more international view of property prices than measuring then purely in the local currency.
What I mean by that is this. If you are in the UK and measure house prices in GBP, then if a house goes from £150,000 to £200,000 you think it's gone up.
But what if someone in another country notices that the GBP has gone down, and convert the price into their local currency, and instead of seeing the price go up, actually see it go down !
From an international perspective, things may not be what you see from a local perspective.
Anyway, for me I'm interested in New Zealand house prices. You can see from this chart that at times it would have been better to be in vested in property. At other times it would have been better to be invested in gold.
I've included 3x possible outcomes if the NZ$, house prices move down by 10, 20 & 30%, and gold up by 10%, 20% and 30%.
The result rather surprised me.
Comment
-
You can get gold charts from a number of places.
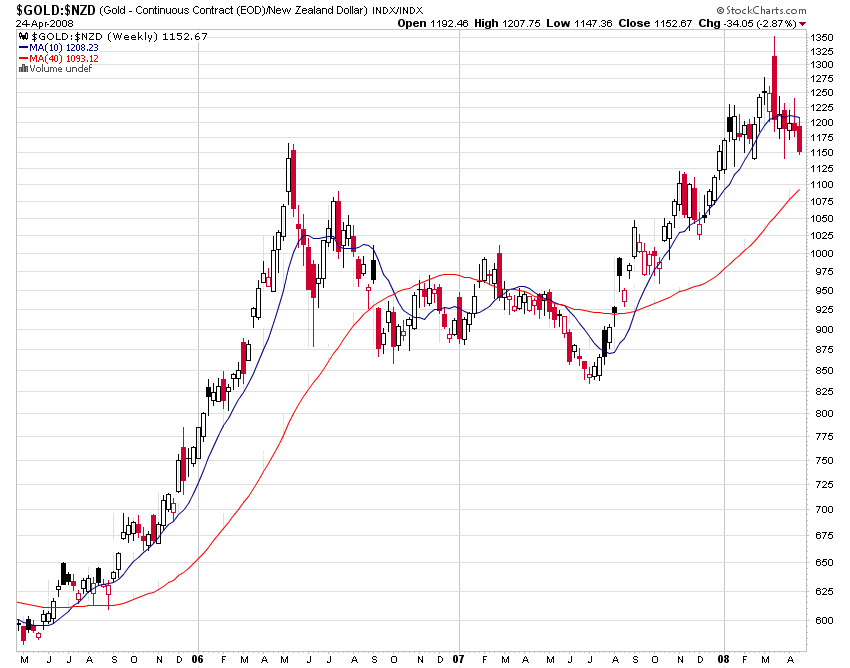
Here is an example from StockCharts, with the price of gold in NZ$:
If you go here, you can change the currency, of various other things:
From : http://stockcharts.com/h-sc/ui?s=$GOLD:$NZD&p=W&b=5&g=0&id=p30732309963
With 50 and 200 day moving averages (on the weekly chart needs 10 & 40). That fooled me for a while.
Comment
-
I'd better be polite and answer your posts!
Thanks muppet. I see you've started a number of gold threads. I hpe we can have interesting discussionsOriginally posted by muppet View PostMore talk about gold and silver in this forum
http://www.propertytalk.com/forum/forumdisplay.php?f=28
I know there are cycle watchers, but this appeared on Jim's site yesterday, obviously with his approval.Originally posted by Austrokiwi View PostYou should have seen that in US$ gold has dropped, though it has remained pretty static against the kiwi. 2nd and third quarters a never great for gold price rises I wouldn't buy until the 4th quarter when the gold price direction is a lot clearer( in the fourth quarter the Indian wedding season starts and thats when physical gold is purchased in larger amounts
http://www.jsmineset.com/ from the 25th.Hey Jim,
As you suggest, the effects of seasonality diminish as gold’s role as money increases. Funny how seasonality discussions appear right before gold gets smashed, as if nothing has changed in the global financial system.
Gold’s role as the universal currency is largely a function of confidence in those to manage it well. I use the following chart as one proxy for that confidence. Nothing is a straight line up or down, but confidence is definitely not increasing.
Sincerely,
CIGA Eric
Comment
-
Yes I knowOriginally posted by exnzpat View PostSteve,
I don’t see a correction for inflation in your graphs.
My personal opinion (probably not shared by the masses) on Gold, is that it is not a very good investment vehicle. The reason for this is that Gold (like oil) resides in a tightly controlled marketplace. It is stockpiled by countries, which at anytime can flood the market and lower its value overnight. While I see no harm in diversifying ones portfolio with precious metals, I do see definite harm in putting all your eggs-in-one-basket, so to speak.
The question is, where do you get the REAL inflation figures ?!
There are some well known inflation adjusted charts though.
Here's one in GBP:
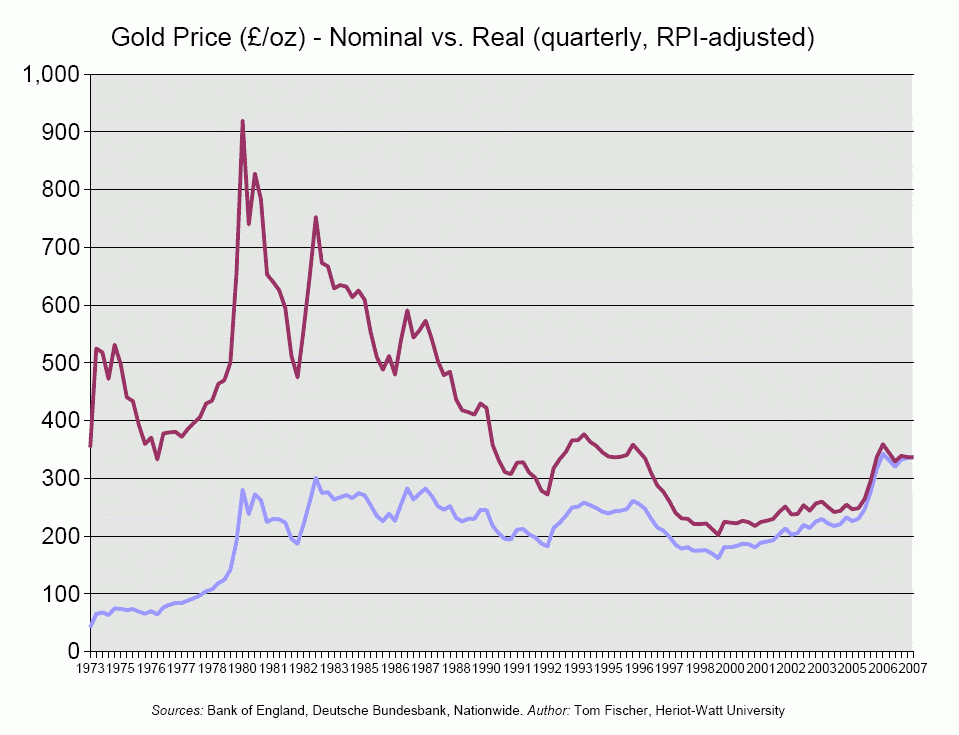
It does show that gold is really no where near being at a peak price.
I certainly agree about the "all your eggs-in-one-basket".
And about the manipulation.
But, you know prices have gone up quite a bit from 2001 despite that. So if you believe in manipulation, you may also believe they can't totally control the price.
We could get into quite a long debate over whether we think they have much gold left to short-sell (lease out).
Comment
-
SorryOriginally posted by Gatekeeper View PostThanks Steve, for the excellent graphs. Quite a few years ago on a thread on this forum we were looking for a NZ house prices graph measured in gold, but couldn't fine one!
You're a bit late!!!!
I tucked away some gold in 04 as a backstop, and just to diversify a bit.
I don't really see it as an investment as such, more as value preservation.
Same time I got into some long term energy investments.
The writing has been on the wall for quite a while for the USD, a global levelling is taking place. I can't see the USD going back to it's former glory, fullstop


If you'd asked me......I'd have been able to tell you I hadn't got one then

I only did them recently !
Great intro for this chart:
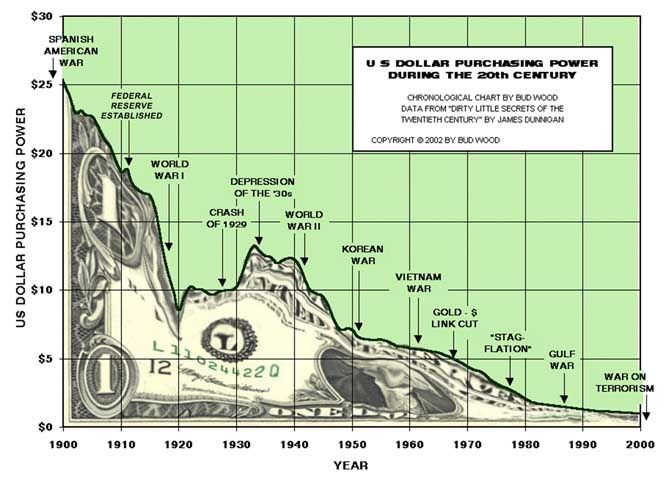
I think it says it all really.
Comment
-
OK, I'm no expert. I just read a lot.Originally posted by Orkibi View PostSteve,
I see that the general trend of Gold is up but quite volatile, do you think Gold will come down to the $500us-$600us range eventually, as part of the cycle ?
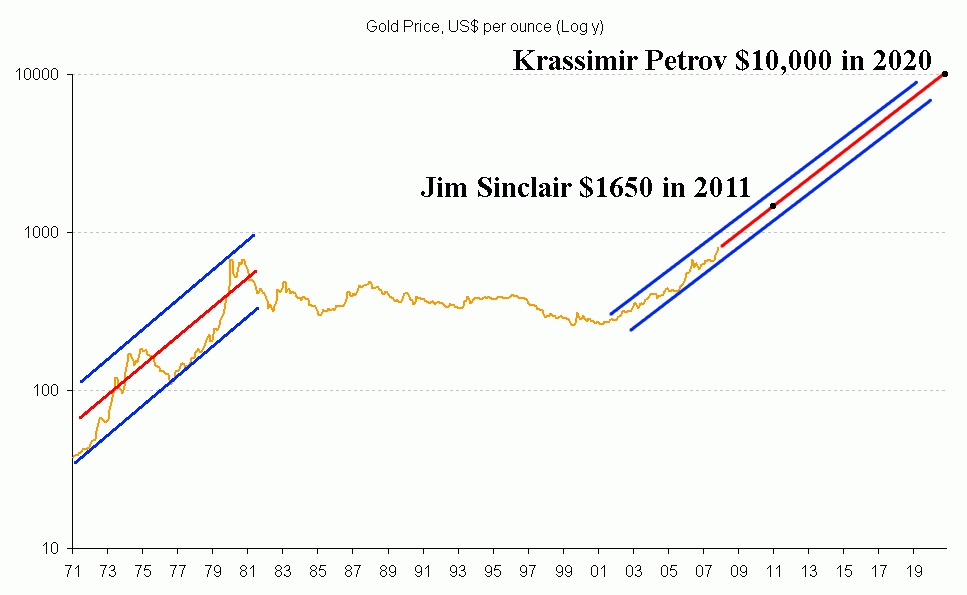
From what I've read, this precious metals (commodities even) bull phase is a long way from ending. Jim is predicting $1650 by 2011, and I think he has quite good reasons for his timing. He has admitted that his price may be a bit conservative, but he is happy with that.
Now he think that this time gold will not peak and then drop again because it will be used to stabilise the US$. I admit I don't fully understand the scheme he thinks they will use, but the result he predicts is a relatively stable price within about $200 of the peak.
One thing I should mention. When Jim says sell. Sell.
He wrote a story about that in the last bull market.
I agree with you about wealth preservation. If you gain a bit fine, but it's MAINLY about safety and preservation.
Comment



Comment